Stock Prediction via Neural Nets
Idea:
The aim of this project is to provide me with a method of forecasting the following days' stock market value, or even to simply predict general stock increase / decrease percentages. As of now, I consider the best way
to do this is through the combination of an expert system and traditional forecasting analysis methods, which are then fed into a neural network along with:
standard stock analysis tools(Moving Avg, Exponential Moving Avg, Current price, Momentum, Time Series Forecasts, etc), with news / social media analysis correlating density of "good" (increase, progress, growth, success...) and "bad" (depletion, crash, poor, mistake...) words.
I honestly have very little experience in the world of economics, and am completing this as my mathematical knowledge grows to be able to understand other ways of understanding the public data. In some ways, my lack of economics depth makes this project more interesting.
Current work:
Ability to extract stock information, manage it, and plot changes over time:
The right graph shows the value of the USD (picked randomly) as a function of what day of the year it is. The left graph shows the change as a percentage relative to the day before.
Expert system progress:
I am not done with this yet, and this will require huge amounts of reading and time. It is a crucial part of the system.
Neural network progress:
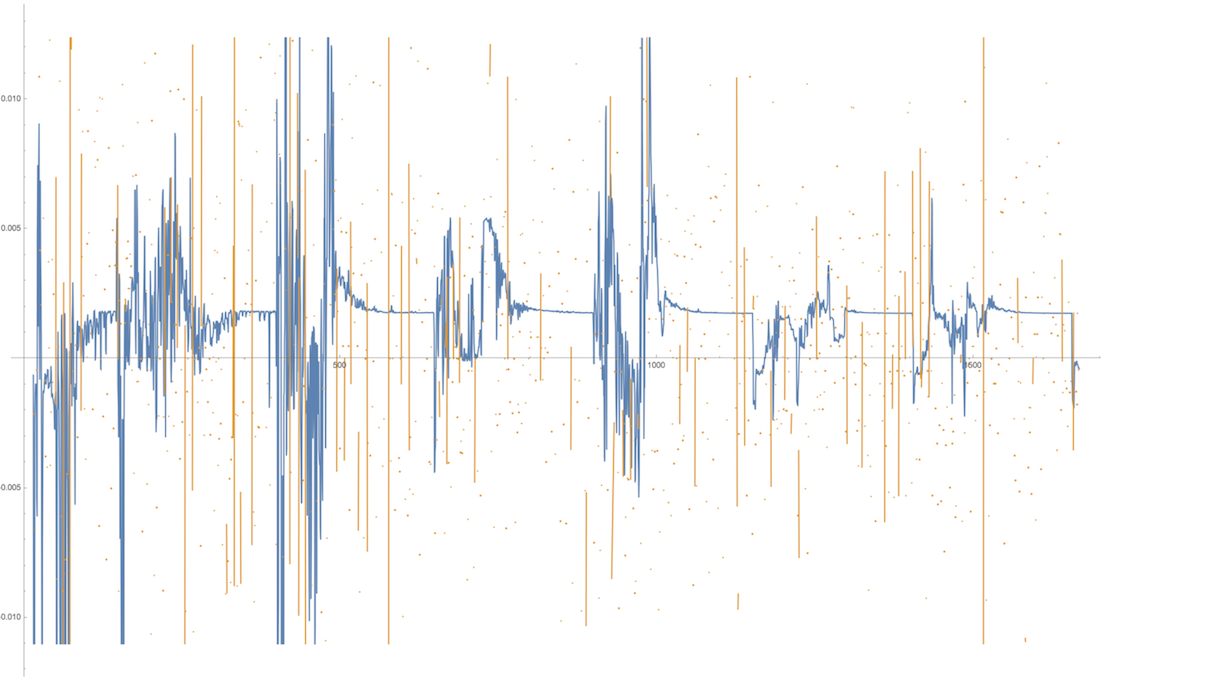
Above, the orange segments show predicted change values, while the blue segments show the real (observed) change values. I currently use a 32-32-16 neural net with Tanh between all layers. As you may notice, with my current model, there seems to be very little correlation between my predicted values and what the stock market did. This is a problem I hope to solve by changing the network structure to something better suited to the problem. In addition, it shows the need for an expert system to contribute data on the mood and direction of the market.
Update (2020):
Progress is being made and I have finally started to actually try using this network for purchasing stocks. I am still working on this project so these are just some teasers / random screenshots.
Stats to send to me:

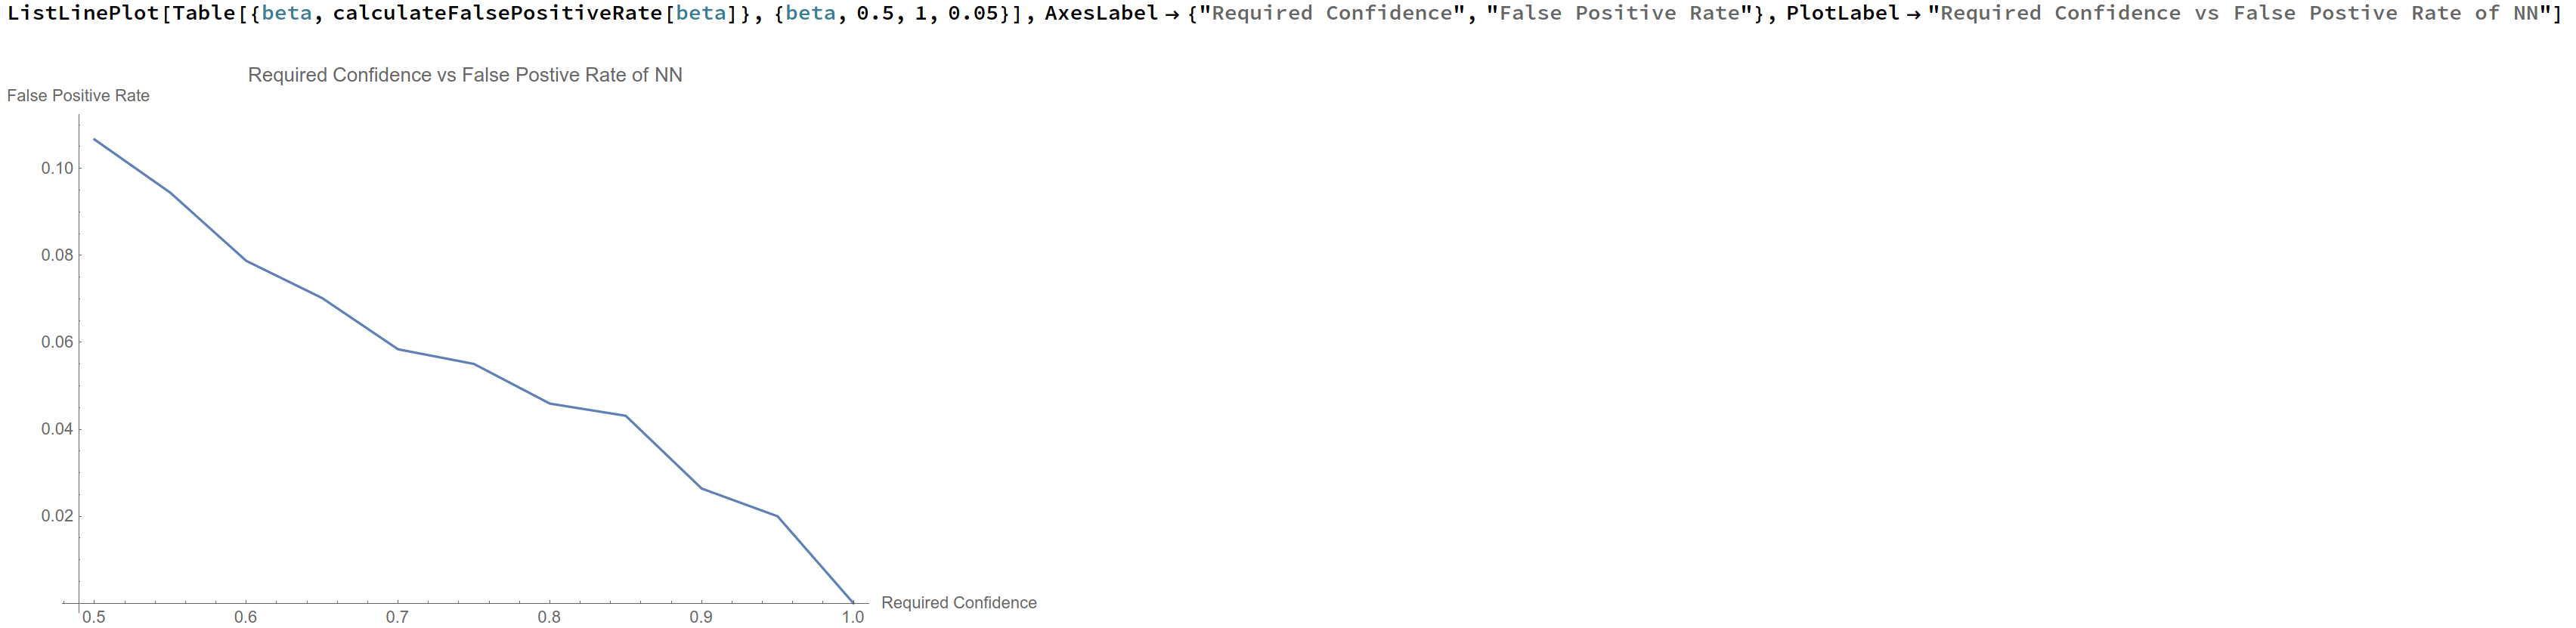
False positive vs confidence graph:
False positive vs False Negative vs Correct Positive vs Correct Negative vs confidence graph:

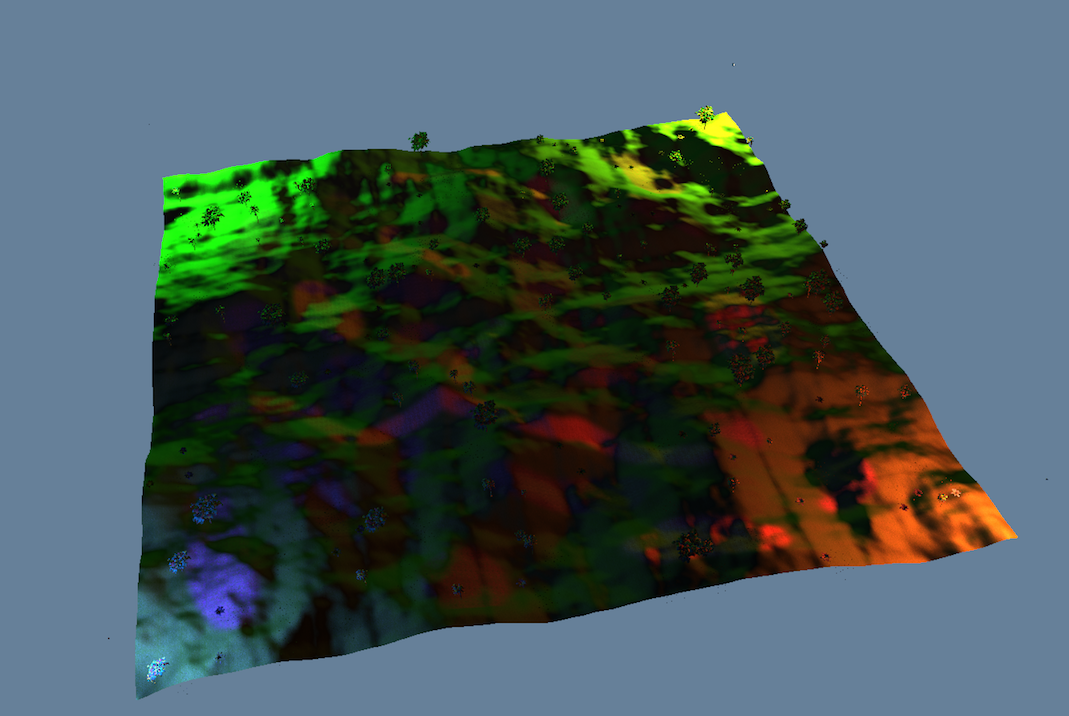
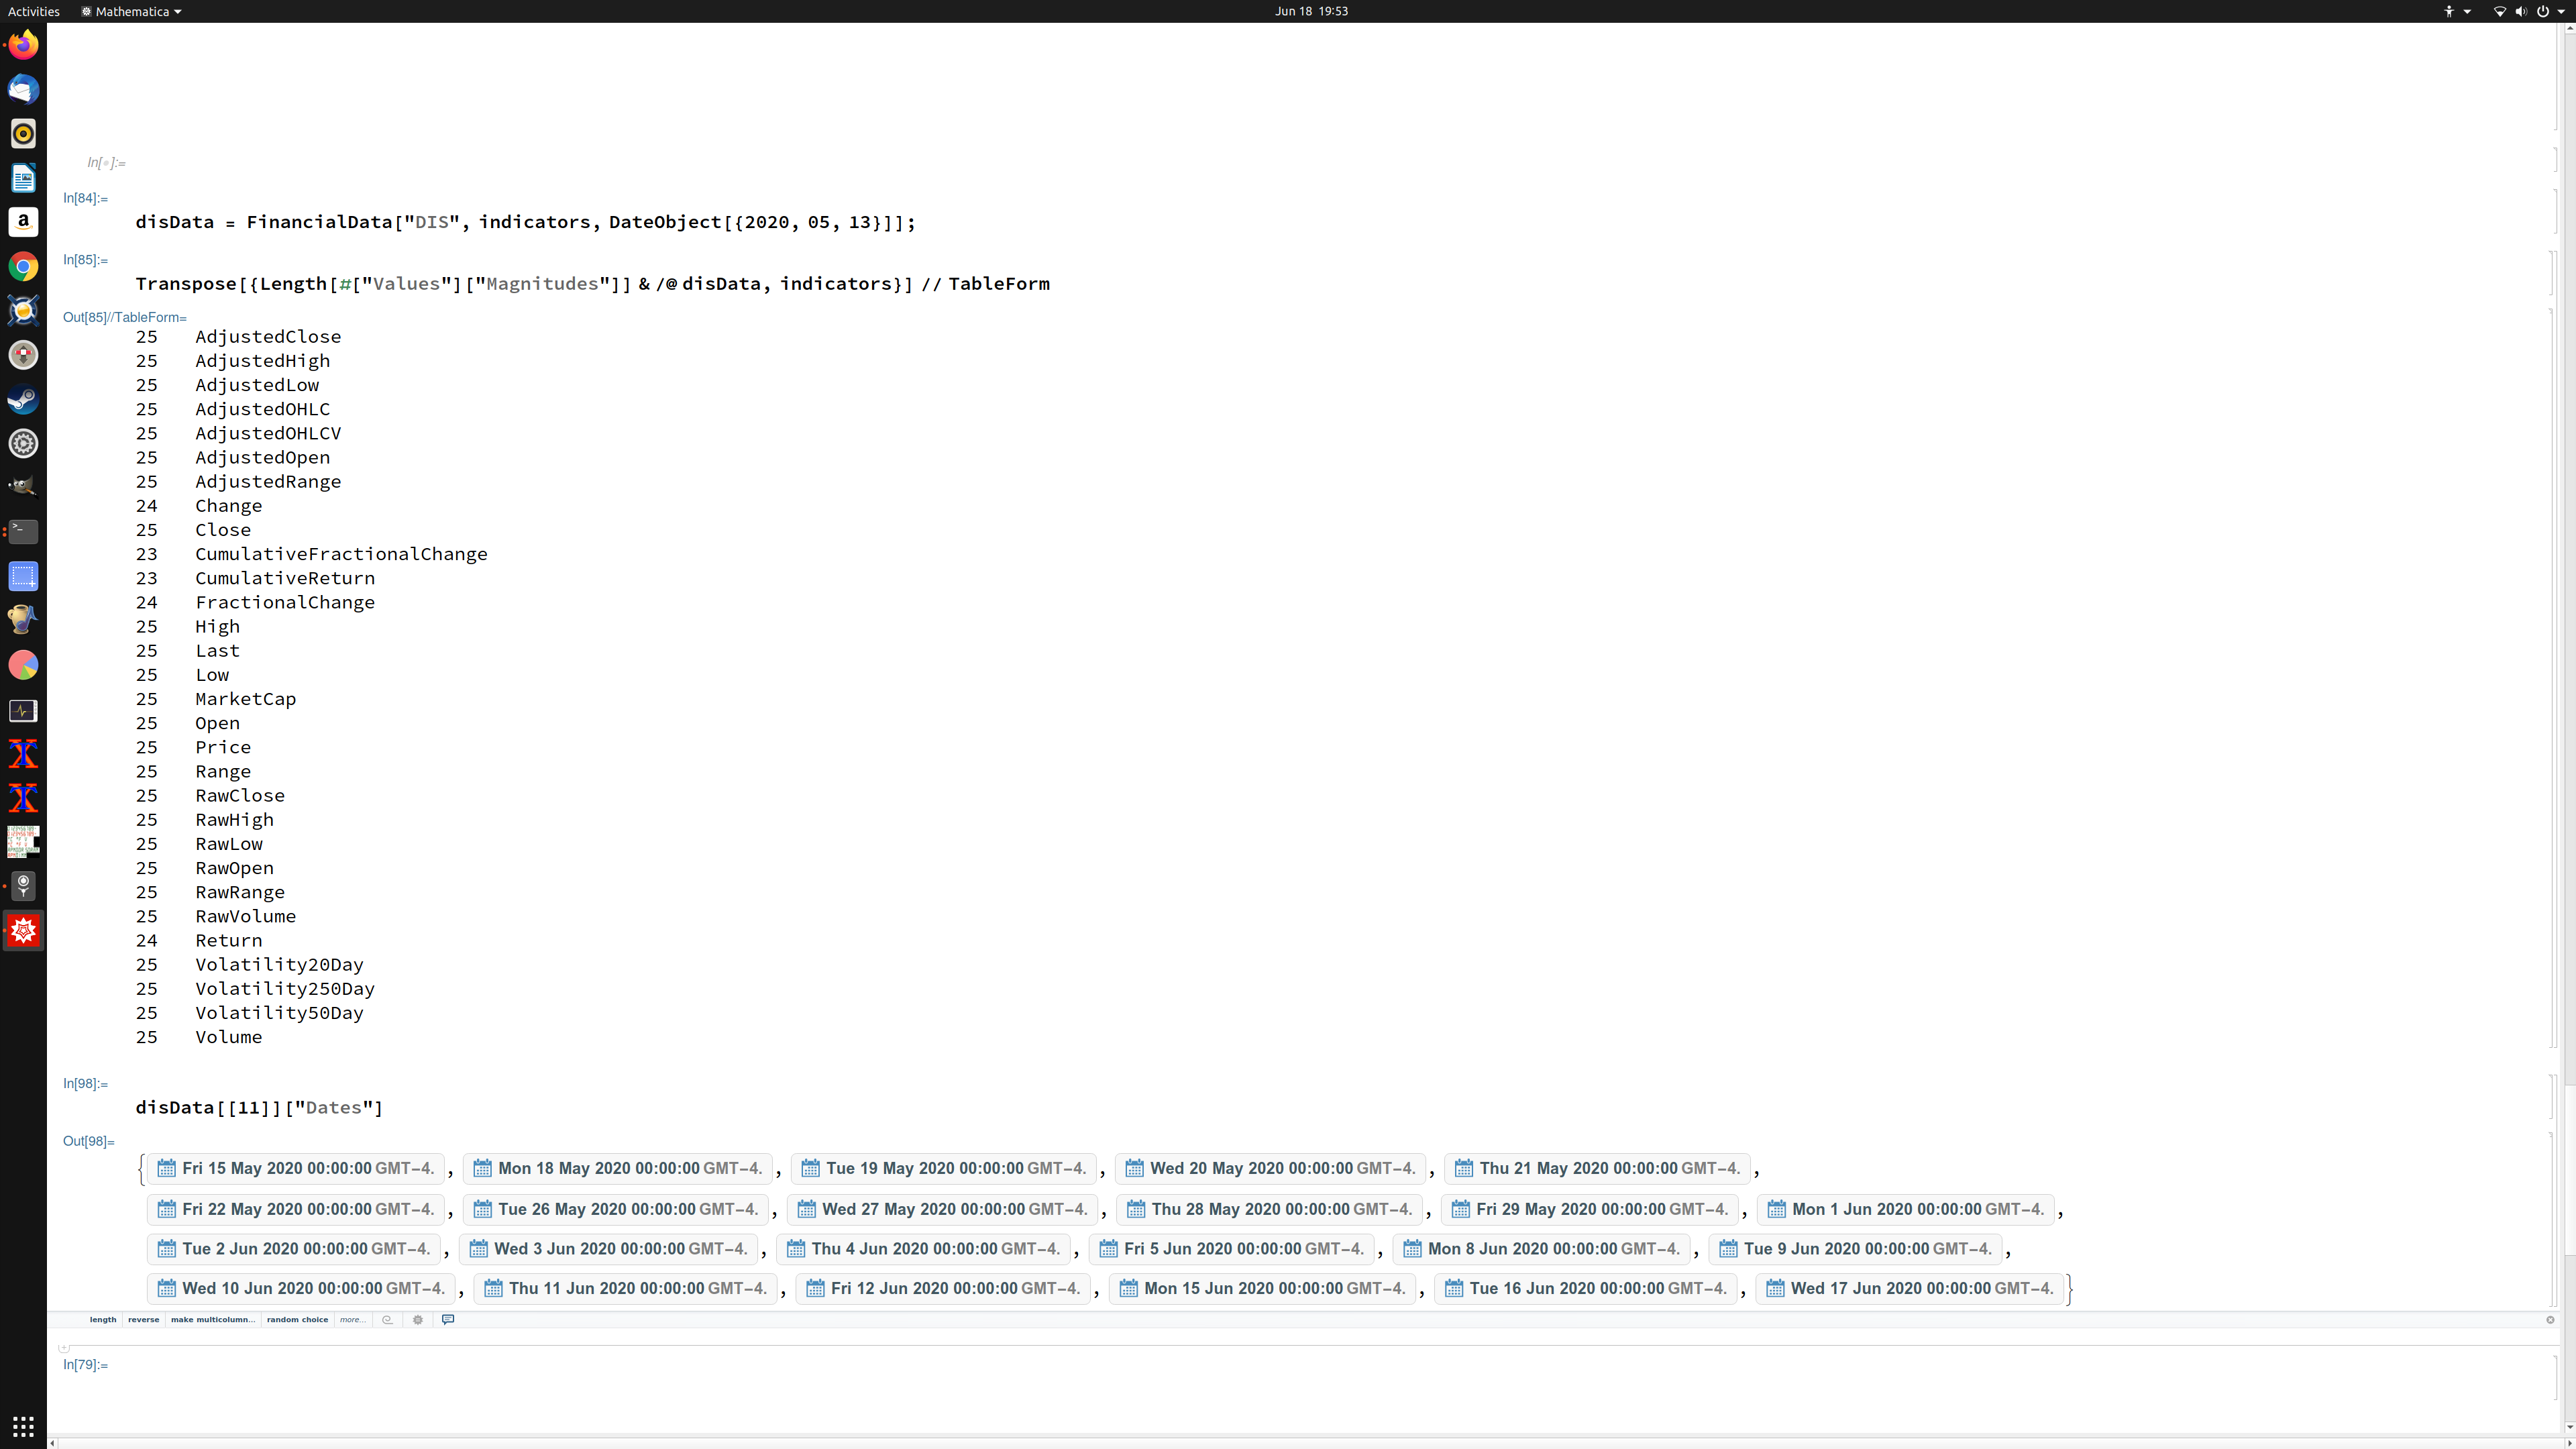
Current indicators:
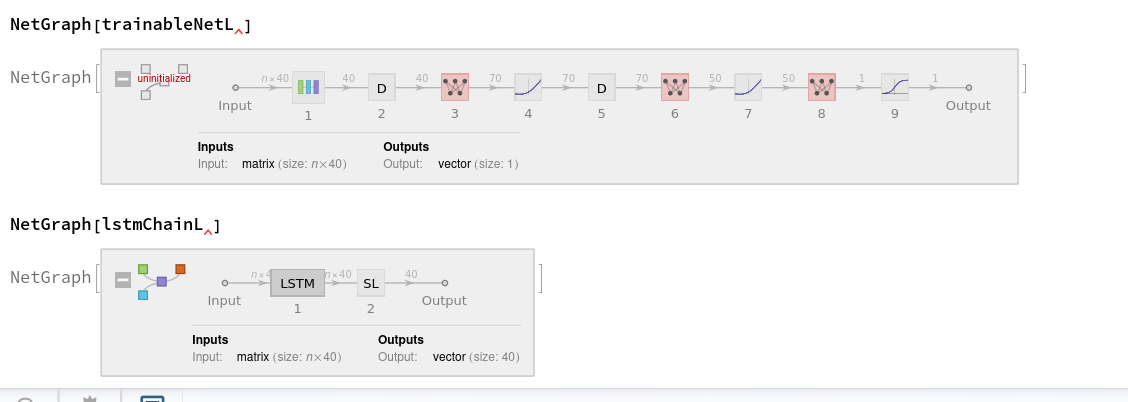
Current network architecture (this has undergone and still undergoes many changes):